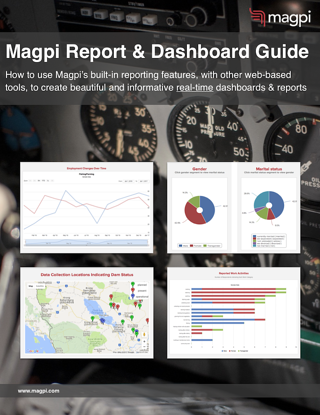
Magpi Report & Dashboard Guide
Download the guide to learn how to use Magpi's built-in data visualization and reporting features.
Big changes are happening in the fields of reporting and data visualization. Reports are changing from pdfs that tell you what happened last month or last year – to live "dashboards" that, like the instrument panel in a plane, describe what’s happening right now.
Magpi Reports require no programming or technical expertise, and include a wide variety of graphs and maps – plus the ability to embed just about anything from online: videos from YouTube or Vimeo, interactive graphs from Google or Zoho, photos, data from Excel, and much more.
In this guide we'll show you how you can move from pdfs or paper report to real-time reporting!