You Asked for Reports, and We Heard You
For some time, users have been asking us to improve the data visualization options in Magpi. Well, we heard you, and we’ve built a whole new visualization functionality into Magpi, called Magpi Reports, that automatically creates reports for every form you use – available immediately.
Each of your Magpi reports is:
beautiful – the built-in formatting looks great on any screen, and is also completely customizable. Need to include your logo? No problem! Match your website colors? Sure!
flexible – re-arrange report elements or text in seconds. Want to include video from the field, or a Google spreadsheet, or a SurveyMonkey form? No problem!
shareable but secure – share Magpi reports with or without a password
embeddable – want to insert all or part of a report into your own website? It’s incredibly easy.
printable – easily print reports to paper or pdf. They’re designed to adjust formatting for maximum legibility in any format
It’s all as easy as you’ve come to expect from Magpi. No programming needed (remember: this is Magpi!) – but if you know HTML, you’ll be able to customize even further.
Collecting -> Visualizing -> Understanding -> Using
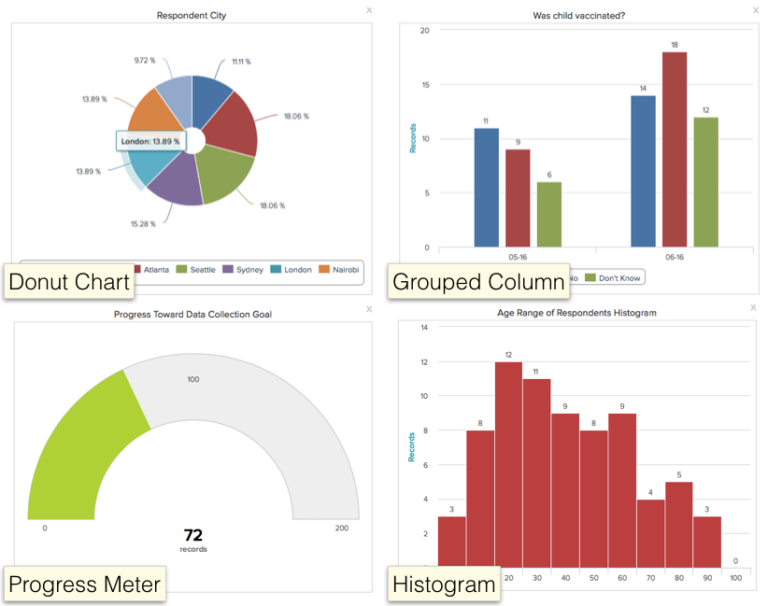
Reports includes favorites like maps and simple column charts, but with many new options, including histograms, pie and donut charts, grouped and percentage column charts, and more – all designed to help you move from just collecting data to really understanding and using.
Based on user feedback, we’ll be adding even more report elements as time goes on – so don’t be shy. Have an idea to make Magpi Reports even better? Is there a type of graph that would make your work easier? Contact us and ask for a demo, or let us know your thoughts and suggestions.
You Already Know How to Use It
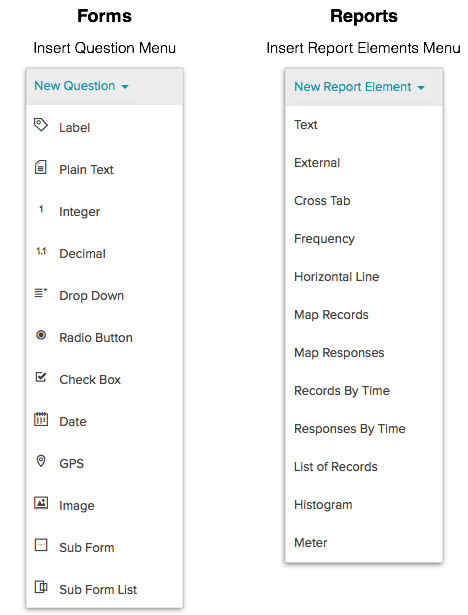
If you have been using Magpi to build forms, you’ll find that editing your reports, or creating new ones, is so similar that it will take you no time at all to get up to speed. Instead of adding new questions one-at-a-time to build your form, in Reports you’ll add new report elements, as shown in this comparison of the menus in Magpi Forms and Magpi Reports:
Related blogs