If you’re choosing a mobile form automation software system, you’ll need to focus on how that system is going to help you in every stage of your activity:
designing and deploying forms
managing your field team
viewing and visualizing datare
integrating data with your existing systems
Designing and Deploying Forms
Even before designing your form, you’ll need to think about what questions your form or survey (or other data activity) is going to answer. Are you collecting standardized information about certain equipment, like a solar power installation? Are you interviewing refugee families at a border station? What types of questions will you need to include.
Your mobile forms automation software will need multiple choice questions, for sure, and probably both “pick one” and “pick all that apply” varieties. Dates, numbers, GPS, photos, signatures — all very commonly used, including in Magpi.

The form design process will need to fit your needs, too: do you already have a form on paper? How will you transfer it into the electronic system? Systems like Magpi allow import of form questions via Excel, or directly creating a form online using pulldown menus and drag-and-drop. Definitely “no-code”: no programming required.
Will you need paper backups of your forms? Make sure your system allows that, too.
Managing Your Field Team
Besides the data that you want to collect with your mobile forms automation system, there will also be a lot of other data — “metadata” — about the mobile data collection process itself. And when collecting data from mobile phones and tablets, in real-time, you need to be able to see and understand and use that metadata in real-time, too.
As an example, Magpi’s dashboard allows you to instantly see:

Magpi’s dashboard data map
who on your field team have already uploaded data
who hasn’t
what’s the average interview time for each field team member
where your data was collected, and when
Think what this metadata means for data quality!
Very short interview times? Well, that could mean that a field team member is cutting corners — while very long times might indicate a team member in need of some refresher training, or a supervisory nudge. And if the Data Map shows data being collected in the wrong place, that’s a pretty sure sign that something isn’t going as planned.
This type of metadata display allows you to identify problems and fix them quickly. It’s a no-brainer for any mobile forms automation system.
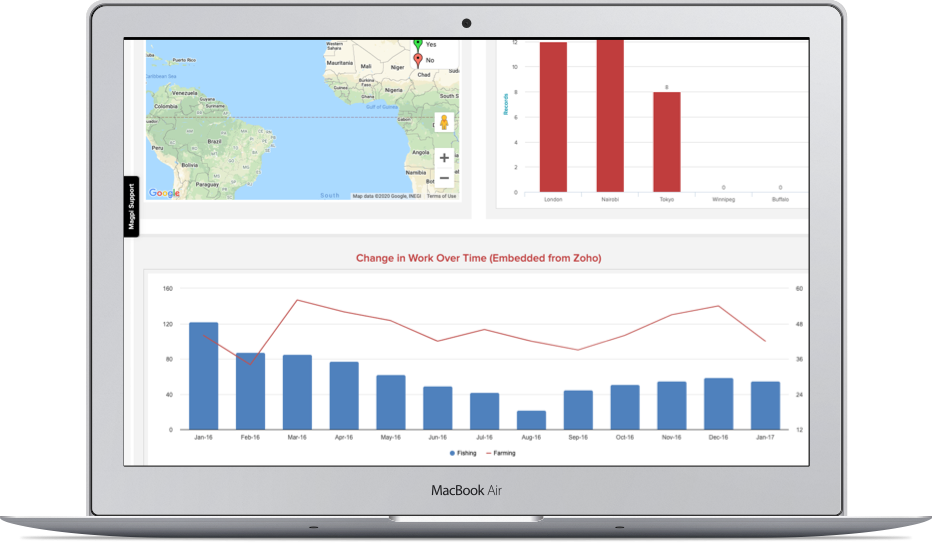
Viewing and Visualizing Data

Some elements of a Magpi report
We’ve been talking about visualizing metadata from your fieldwork, but of course you’ll need to visualize the data from your specific form, as well. And while there are terrific systems — like Microsoft PowerBI — that are entirely devoted to data visualization, it’s also good when your mobile forms automation system has solid built-in visualization, as well, for times when you just don’t need to bring in the big guns like PowerBI.
In Magpi, we handle this with our no-code Reports function, which enables you to quickly point-and-click your way to a solid basic report, with all the usual suspects: column and pie charts, images, text formatting — and the ability to embed other important bits and pieces, like YouTube videos, your organizational logos, and more. Click here to view a sample Magpi report.
Of course, sometimes you do need those big guns, and your system will need to let you easily (meaning: without programmers) get your data into those beautiful graphs and charts in real-time. For that, you’ll need a full-set of integrations: read on.
INTEGRATIONS
No system is an island, and your mobile forms automation software will need to “play well with others.” As we were just saying in the last section, a classic example of this is for data visualization: no mobile form system out there can visualize like Microsoft BI, so it better be able to get your data into BI, or Tableau, or whatever your tool of choice is for visualization.
Getting Magpi data to PowerBI is simple, and just takes minutes.
Of course, there are lots of reasons you want to connect your field data to the rest of the software world: for backup, for analysis, for sharing, for visualization, and probably a few other things, too. And any system will need to let you do that: move data from point A to point B with the minimum of fuss (hopefully, again, without any programming).
Within Magpi, we provide users with a range of options for useful workflow automation:
move your Magpi data automatically into Excel or Google Sheets, just once or continuously, with just a few clicks. Do it for backup, or do it just because it’s cool.
use our partner Zapier to flow your Magpi data into more than a thousand other pieces of software, and trigger thousands of actions (no-code? you bet!). Move the data automatically into your MySQL database. Trigger automatic emails (or Tweets. Or Instagram posts).
OK, if you have programmers — or you are a programmer — yes, you can use our API and knock yourself out creating any kind of bespoke integration you can imagine
And you’ll need to think about your integration needs when you choose a mobile forms automation software system. Our advice? Look for built-in power, but also the flexibility to “order out” when there’s a graph, or an analysis, or something else that is better done elsewhere.
Magpi Report & Dashboard Guide
Download the guide to learn how to use built-in data visualization and reporting features.
Related blogs